-
AICE 작은 예제 및 참고용 코드카테고리 없음 2024. 6. 27. 13:21728x90반응형
1. 전처리
- train, validation 함께 전처리 => 전처리(ex> 정규화 기준 동일하게)2. 그래프
- ax = sns.countplot(x=df_total['level1_pnu'], palette = "RdBu")

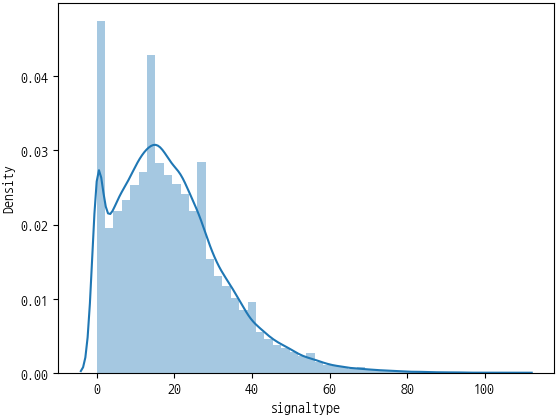
- sns.distplot(df_total['signaltype'])

- sns.boxplot(x = df_total['level1_pnu'], y = df_total['A_DISTANCE'], data = df_total, palette = "RdBu")

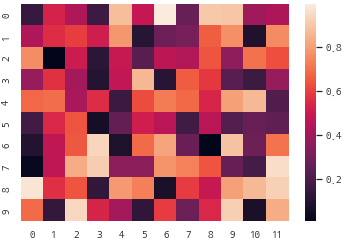
- sns.heatmap(np.random.rand(10, 12)) => 상관관계 분석 등에서 한 눈에 바로 확인할 수 있는 차트

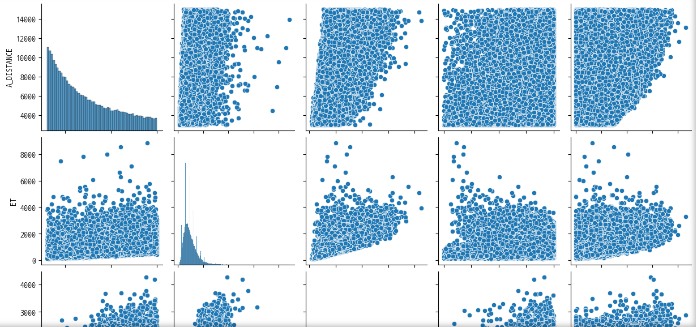
- sns.pairplot(df_total) => 데이터 프레임의 수치형 변수를 기준으로 밀도와 분포를 한 눈에 확인할 수 있는 차트

3. 상관관계 분석
# 필요한 라이브러리 가져오기
# 그냥 무조건 가져온다고 생각하자 : pandas, numpy, seaborn, matplotlib.pyplot
# seaborn 설치가 되어 있지 않으면 라이브러리는 설치 필요 : !pip install seaborn
!pip install seaborn
import pandas as pd
import numpy as np
import seaborn as sns
import matplotlib.pyplot as plt
# Seaborn에서 제공하는 데이터셋 확인하기
sns.get_dataset_names()
# 많이 사용하는 데이터는 'iris' , 'tips' , 'titanic'
# 그중에서 iris 데이터셋 가져오기
# seaborn load_dataset('iris') 함수 활용 : 결과 iris 저장
iris = sns.load_dataset('iris')
# 가져온 iris 데이터 앞 5개 확인 하기
# 자동으로 판다스 데이터프레임 형식으로 읽어짐
iris.head()
# 간단하게 시각화해 보기
# 여러분은 잘 모르지만, 나중에 이렇게 시각화를 할수 있구나 알기
# value_counts 함수 이용해서 species 컬럼에 대한 분포 확인
iris['species'].value_counts()
# value_counts 함수 이용해서 species 컬럼에 대한 분포 확인값을 bar 차트 그리기
iris['species'].value_counts().plot(kind='bar')
# 판다스 plot 함수 활용해 산점도(scatter) 그래프 시각화해 보기
# 입력 : kind='scatter', x='sepal_length', y='petal_length'
iris.plot(kind='scatter', x='sepal_length', y='petal_length')
# 이번에는 seaborn scatterplot 함수 활용해서 산점도 그리기
# 입력 : data=iris, x='sepal_length', y='petal_length', hue='species'
# 위와 똑같은 그래프지만, 붓꽃 종류로 분류해서 그래프
# 붓꽃 종류 3가지가 구분되어 보입니다.
sns.scatterplot(data=iris, x='sepal_length', y='petal_length', hue='species')
# IRIS 데이터 뒤 5개 보기
iris.tail()
# X 분리 : 판다스 drop 함수 활용
# 입력 : 'species', axis=1
X = iris.drop('species', axis=1)
# 분리된 X 확인 : 데이터 타입이 데이터프레임 확인
X
# y 분리 : 'species' 컬럼값만 분리
y = iris['species']
# 분리된 y 확인 : 데이터 타입이 Series 확인
# y 값이 문자열로 되어 있음 확인
y
# Series, DataFrame 형태를 numpy array 변경하기
# 뒤쪽에서 타입이 맞지 않아서 에러 날수 있기 때문에
# X.values , y.values --> X , y 입력
X = X.values
y = y.values
print(X[:2])
print(y[:2])
# y값이 숫자가 아니기에 컴퓨터가 잘 이해하지 못해 숫자로 변환
# setosa --> 0, versicolor --> 1, virginica --> 2 : LabelEncoding
from sklearn.preprocessing import LabelEncoder
# 1. LabelEncoder 함수 정의 : le
# 2. y값에 대해 fit_transform 함수 이용해서 라벨인코딩 수행하고 다시 y에 저장
# 3. le.classes_ 출력해서 어떤 라벨들이 인코딩 되었는지 확인
le = LabelEncoder()
y = le.fit_transform(y)
print(le.classes_)
# y값들이 라벨인코딩되어 숫자로 표현됨 확인
y[:10]
# Train / Test 데이터셋 나누어주는 함수 : train_test_split
from sklearn.model_selection import train_test_split
# train_test_split 함수 활용
# 입력 : X, y
# Train : Test => 8 : 2 비율로 나누기 : test_size=0.2
# Train 데이터와 Test 데이터에 y가 쏠리지 않도록 하기 : stratify=y
# 매번 같은 결과 나오도록 값 고정 : random_state=42
# 결과 저장 : X_train, X_test, y_train, y_test
X_train, X_test, y_train, y_test = train_test_split(X, y, test_size=0.2 , stratify=y, random_state=42)
# Train 과 Test 데이터셋 사이즈 확인
# X_train.shape, X_test.shape, y_train.shape, y_test.shape 확인
X_train.shape, X_test.shape, y_train.shape, y_test.shape
# DecisionTree 머신러닝 모델링
from sklearn.tree import DecisionTreeClassifier
# 1. DecisionTreeClassifier 모델 정의 -> dt 저장
# 2. dt 모델 학습 : X_train, y_train
# 3. dt 모델 성능확인 : X_test, y_test
dt = DecisionTreeClassifier()
dt.fit(X_train, y_train)
dt.score(X_test, y_test)
# RandomForest 머신러닝 모델링
from sklearn.ensemble import RandomForestClassifier
# 1. RandomForestClassifier 모델 정의 -> rf 저장
# 2. rf 모델 학습 : X_train, y_train
# 3. rf 모델 성능확인 : X_test, y_test
rf = RandomForestClassifier()
rf.fit(X_train, y_train)
rf.score(X_test, y_test)
# X_test 첫라인 샘플 데이터 와 정답 출력
# setosa --> 0, versicolor --> 1, virginica --> 2
print(X_test[0:1])
print(y_test[0:1])
# X_test 첫라인 샘플 데이터을 모델 입력해서 예측하기
# rf 모델의 predict 함수 활용
# 입력 : X_test[0:1], 결과 : pred 저장
# pred 결과 출력
pred = rf.predict(X_test[0:1])
print(pred)
# 딥러닝 필요한 라이브러리 가져오기
import tensorflow as tf
from tensorflow.keras.models import Sequential
from tensorflow.keras.layers import Dense
# Sequential 모델 만들기 --> model 변수 저장
# input layer : (4, )
# hidden layer : 6 unit , activation='relu'
# output layer : 3 unit , activation
model = Sequential()
model.add(Dense(6, activation='relu', input_shape=(4,)))
model.add(Dense(3, activation='softmax'))
# 모델 컴파일 : compile
# loss='sparse_categorical_crossentropy'
# optimizer='adam'
# metrics=['accuracy']
model.compile(loss='sparse_categorical_crossentropy', optimizer='adam', metrics=['accuracy'])
# 모델 학습 : fit
# X_train, y_train, epochs=10, batch_size=8
# 학습결과 저장 : history
history = model.fit(X_train, y_train, epochs=10, batch_size=8)
# epochs 횟수 증가하여 모델 학습 : fit
# X_train, y_train, epochs=50, batch_size=8 --> epochs 50으로 변경
# 학습결과 저장 : history
history = model.fit(X_train, y_train, epochs=50, batch_size=8)
# epochs 횟수 증가하여 모델 학습 : fit
# X_train, y_train, epochs=50, batch_size=8 , validation_data=(X_test, y_test)
# 학습결과 저장 : history
history = model.fit(X_train, y_train, epochs=50, batch_size=8, validation_data=(X_test, y_test))
# 모델 학습 정보
history.history
# matplotlib 이용하여 그래프 그리기
# 1. plot 그리기 : 입력 history.history['loss'] , history.history['val_loss']
# 2. plot 그리기 : 입력 history.history['accuracy'] , history.history['val_accuracy']
# 3. title : 'Loss and Accuracy'
# 4. xlabel : "Epochs"
# 5. ylabel : "Loss"
# 6. legend : ["Loss", "Accuracy"]
# 7. plt.show()
plt.plot(history.history['loss'])
plt.plot(history.history['accuracy'])
plt.plot(history.history['val_loss'])
plt.plot(history.history['val_accuracy'])
plt.title('Loss and Accuracy')
plt.xlabel("Epochs")
plt.ylabel("Loss")
plt.legend(["Loss", "Accuracy", "Val_loss", "Val_Accuracy"])
plt.show()
[실습-정답] Python 활용한 AI 모델링 - 전처리 파트
[문제] df 데이터프레임에서 'customerID' 컬럼 삭제 하세요.
# DataFrame drop 함수
# 'customerID' 컬럼 삭제
# axis=1 옵션 사용해서 컬럼단위 삭제 수행
# inplace=True 옵션 사용하여 df DataFrame에 저장
df.drop('customerID', axis=1, inplace=True)
컬럼 내용 변경하기
범주형 문자 데이터를 숫자 변환하는것은 성능에 많은 영향을 미치므로 꼭 변환하로록 하자.
null, _ 문제있는 문자 데이터를 모델링하기 전에 미리 다른 데이터로 변경하거나 필요없을 경우 삭제하도록 하자.
# Boolean indexing으로 검색
cond = (df['TotalCharges'] == '') | (df['TotalCharges'] == ' ')
df[cond]
728x90반응형